What is possible and not possible during the Nativity Fast?
In 2018, the Nativity Fast will begin on November 28. During this period, Orthodox believers prepare to celebrate Christmas...
Practical lesson 1, 2. Solving problems in equilibrium thermodynamics (4 hours)
Lesson plan: Second law of thermodynamics. Formulations of the second law (law) of thermodynamics. Entropy and its properties. Calculation of entropy changes in various equilibrium processes. Entropy in nonequilibrium processes. Examples of problem solving.

The concept of entropy
Entropy, denoted by the letter S, was introduced by R. Clausius when analyzing material on heat engines, initially in the form of the so-called “reduced heat”
where Q is the amount of heat that the system exchanges with the environment during a reversible process; T - temperature.
From (1) it follows that entropy is measured in joules per Kelvin (J/K). Entropy is a function of state, i.e. its change does not depend on the path along which this change occurs, but is determined only by the difference in entropy values in the final and initial states. Also, entropy. extensive property of the system. This means that the entropy of the entire system (S) can be found by summing the entropy values of all components of the system ():
Clausius proved that, despite the fact that heat is a function of transition and depends on the path of the process, the value of the ratio of heat to absolute temperature does not depend on the path of the process, i.e., it is a function of state. This state function is entropy. From the position that entropy is a function of state it follows that an infinitesimal change in entropy is a total differential, and a finite change in entropy as a result of some process can be found as
 (3)
(3)
Let us write expression (1) for infinitesimal quantities
https://pandia.ru/text/80/204/images/image008_28.jpg" width="168" height="63">(5)
Formulas (3 −5) are the basic formulas for calculating entropy. Having revealed the meaning, dQSΔ can be calculated in each specific case.
Following Clausius's reasoning, we can introduce a new always positive quantity, which is the difference between TdS and at an irreversible change. This value is determined by the relation:
Equation (6) can be rearranged
where for reversible changes and 0=′Qd0>′Qd for irreversible.
Clausius called it uncompensated heat. In classical thermodynamics, this quantity had a rather qualitative character. Usually it was simply stated that Qd′0=′Qd for reversible changes and for irreversible changes, and the value 0>′QdQd′ was not calculated.
By the way, the term “uncompensated heat” is not entirely appropriate. Heat is the energy that a system exchanges with the outside world and, therefore, that passes through the surface that limits the system from the outside world. And that heat, which Clausius called uncompensated, arises as a result of processes occurring within the system itself.
It should be noted that at the present stage of development of physical chemistry, a quantitative assessment of the increase in entropy during irreversible processes is possible.
One of the formulations of the second law of thermodynamics is as follows: for any isolated system that is in a nonequilibrium state, the entropy increases over time, and its growth continues until the system reaches an equilibrium state.
This law is also called the law of increasing entropy. Mathematically it can be written in the form
where the inequality sign refers to a nonequilibrium process, and the equal sign refers to equilibrium.
From expression (8) it follows that the entropy of an isolated system can only increase, but can never decrease. At equilibrium, entropy is maximum.
All calculations of entropy changes in various processes are based on the use of the Clausius inequality, which relates the change in entropy dS to the amount of heat that the system exchanges with the environment at temperature T
The sources of irreversible processes can be: diffusion, expansion of the system when there is a pressure difference between it and the environment, heat transfer at different temperatures, spontaneous chemical reactions in the volume of the system and other dissipative processes associated with the irreversible conversion of work into heat. Inequality (9) is satisfied regardless of the cause of the irreversible process; as a result, an additional amount of heat is released within the system. As mentioned earlier, R. Clausius called this heat caused by nonequilibrium processes uncompensated heat.
It is known that if the process is carried out in equilibrium and reversibly, then the work done is maximum. If the process is carried out irreversibly, then the work turns out to be less than in a reversible process, part of it is lost. In accordance with the first law of thermodynamics, “lost” work must appear in another form, for example, in the form of uncompensated heat, which is always non-negative: greater than zero in irreversible processes, equal to zero in reversible processes.
For isothermal processes, inequality (10) can be written as equalities
Where is the change in entropy caused by equilibrium heat exchange with the environment (index “e” from Latin external. external);
growth of entropy due to irreversible processes within the system (index “i” from the Latin internal - internal).
The entropy value of a given system cannot be measured directly experimentally, but it can be calculated using the formula
This formula allows you to find not the absolute value of entropy, but the difference in entropy in two states of the system, i.e., the change in entropy when the system transitions from state 1 to state 2.
In table Table 1 shows the basic relationships characterizing the change in entropy in various processes. Analysis of the table 1 shows that for any system (isolated, closed or open), the change in entropy due to internal causes is not negative, that is, it is fair. 0≥Sdi
Nonequilibrium thermodynamics (thermodynamics of nonequilibrium processes) studies the general laws of systems in which nonequilibrium processes occur: heat transfer, diffusion, chemical reactions, electric current transfer, etc.
Classical thermodynamics, as the science of the mutual transformation of work and energy, studies equilibrium processes. Let us briefly dwell on the features of nonequilibrium thermodynamics.
 When considering the second law of thermodynamics for open systems, much attention is also paid to the change in entropy. A change in the entropy of an open system can occur either due to the occurrence of internal irreversible processes within the system itself (), or due to exchange processes between the system and the external environment (). SdiSde
For systems considered in chemistry, a change can be caused, for example, by the occurrence of a chemical reaction within the system, and the magnitude. supply or removal from the system of both heat and reagents and products. SdiSde
In the thermodynamics of nonequilibrium processes, it is postulated that the components and are independent, and the total change in the entropy of an open system is equal to their sum:
If only thermally reversible changes occur in the system, then = 0. If there are irreversible changes > 0.
In isolated systems there is no heat and mass exchange with the environment and value = 0, then equation (13) is transformed to the following form:
i.e., to the classical formulation of the second law of thermodynamics for isolated systems.
Any nonequilibrium process in the system: mixing of gases, spontaneous straightening of a compressed spring, chemical reaction - leads to an increase in the disorder of the molecular state of the system. This is expressed quantitatively in an increase in the thermodynamic probability of the state of the system and in an increase in entropy.
An important characteristic of nonequilibrium processes is that they occur at a finite speed. Their study is essentially the field of kinetics. Time in nonequilibrium thermodynamics is a parameter.
So, if entropy arises in time τ, then we need to talk about the rate of its occurrence τdSdi. In foreign literature, this quantity is called entropy production. The quantity τdSde is called the rate of entropy exchange between the system and the environment. With the introduction of these concepts, from equation (13) we obtain an equation for the rate of total entropy change in the system τddS:
A positive value of τdSde corresponds to an increase in entropy as a result of the exchange of matter and/or energy with the external environment. A negative value of τdSde indicates that the outflow of entropy from the system to the external environment exceeds the influx of entropy from the outside. This shows a fundamental difference in the thermodynamic properties of open and isolated systems: the total entropy of an open system can either increase or decrease, since the value τdSde can be either positive or negative.
The inequality τdSdi> 0 is always valid, but with respect to the general increase in entropy the following cases are possible:

In the latter case, a stationary state is established in the system, in which the production of entropy in the system due to irreversible internal processes is compensated by the outflow of entropy into the external environment.
Calculation of entropy change with temperature change
The change in entropy of a system whose temperature, for example, increases at constant volume from T1 to T2, is calculated by integrating the partial derivative of entropy with respect to temperature at constant volume
Where. isochoric heat capacity of the system, J/K. V.C.
If no phase transformations occur in the system in the specified temperature range, then integration (15) leads to the following expression:
The change in entropy at constant pressure can be found by integrating the partial derivative of entropy with respect to temperature at constant pressure
Where. isobaric heat capacity of the system, J/K.
When solving equations (16) and (18), two cases are possible. Let us consider them using equation (18) as an example, i.e., with an isobaric temperature change.
Case 1. The heat capacity of a substance in the temperature range from to does not depend on temperature. Then after integration (18) we have
The constancy of heat capacity is most often characteristic of ideal gases; it is in this case (unless otherwise stated in the conditions of the problem) that the change in entropy during isobaric heating can be calculated using formula (19). According to the classical theory of heat capacity of ideal gases, it can be assumed that the molar isochoric heat capacities for a monatomic and diatomic ideal gas are equal, respectively
https://pandia.ru/text/80/204/images/image030_6.jpg" width="421" height="35">
However, it must be borne in mind that sometimes for ideal gases a dependence of the heat capacity on temperature is observed (this happens at high temperatures).
Case 2. Heat capacity is some function of temperature.
The temperature dependence of the molar isobaric heat capacity is usually expressed by power series of the form
where are empirically found coefficients. Their meanings are given in reference literature. Typically, in such a power series, only three terms are taken into account: or c, c,b, a′c, b,ac, b,a′ - depending on which class the substance belongs to: the class of organic substances or the class of inorganic substances. Exactly what coefficient or cс′ needs to be taken into account in equation (23) follows from the reference data table, which lists all the coefficients. It is obvious that if, for example, the coefficients are given, then the coefficient c, b, ac′ will be equal to zero.
Substituting expression (23) into (18) allows, after integration, to obtain the following expression

Using formula (24), the change in the entropy of a substance is calculated when its temperature changes from T1 to T2. This change applies to one mole; in case of finding the total change in entropy, you need to use the formula snSΔ=Δ, where n is the number of moles.
Calculation of entropy change during phase transition
During various phase transitions: crystallization, melting, evaporation, sublimation, etc., the degree of ordering of the system changes, i.e., the phase transition is accompanied by a change in entropy. For example, during evaporation, a compact condensed phase turns into a gas, which occupies a much larger volume. In this case, there should be a significant increase in the entropy of the substance. Entropy increases during the transition from a crystalline state to a liquid and from a liquid to a gas.
Consider a system consisting of pure water and the environment at normal phase transition temperature, that is, at a temperature where the two phases are in equilibrium at 1 atm. For the ice melting process (equilibrium: solid water - liquid water) this temperature is 273 K, and for the evaporation process (equilibrium: liquid water - steam) 373 K. Since both phases in each of the phase transitions under consideration are in equilibrium, then any heat exchange between the system and the environment occurs reversibly. At constant pressure, the amount of heat will correspond to the enthalpy, therefore the molar entropy of the phase transformation f. n.sΔ can be calculated using the formula
where is the molar enthalpy of phase transformation; f. p.hΔ
f. p.T is the temperature of phase transformation.
During crystallization or condensation, exothermic phase transformations are observed (< 0), характеризующиеся отрицательным значением энтропии. При этом происходит уменьшение беспорядка при переходе от жидкости к твердому телу (процесс кристаллизации) или от пара к жидкости (процесс конденсации). Изменение энтропии при эндотермическом переходе (>0) is positive, and the system becomes more disordered. Melting and evaporation are endothermic processes accompanied by an increase in the entropy of the system. f. p.hΔ
In table Table 2 shows the values of the molar entropy of phase transitions of some substances.

As can be seen from table. 3, which gives the standard molar entropy of evaporation of some liquids at boiling temperatures, many liquids have approximately the same standard entropy of evaporation of about 85 J/(mol. K). This empirical pattern is called Truton's rule. Trouton's rule can be explained if we assume that when various liquids evaporate and turn them into gas, the degree of disorder turns out to be practically the same, regardless of the substance. If this is true, then most liquid substances should have close values of the standard molar entropies of evaporation.
 Significant deviations from Trouton's rule are observed in liquids in which partial association of molecules occurs. For example, in water, in which there are hydrogen bonds and structuring of the liquid, upon evaporation the system becomes more disordered than if the molecules were randomly distributed in the volume of the liquid phase.
Calculation of the change in entropy of a system with a change in temperature and the presence of a phase transformation
Since entropy is a function of state, the path of transition from the initial state to the final state can be any. A possible option is a reversible isobaric temperature change to the phase transition temperature, then the phase transition itself, and then a reversible isobaric temperature change to the final temperature.
The total change in entropy will consist of three terms. For example, let a certain conditional substance A transition isobarically from a solid state at temperature to a liquid state at temperature. Already from the conditions of the problem it is clear that at a certain temperature a phase transformation (phase transition) - melting - takes place. We find this temperature in the reference book and designate it in general terms. The first contribution to the total entropy change is the heating of the solid system from temperature to the melting point
At the melting temperature, the solid state transforms into a liquid state, the entropy changes abruptly, i.e., the total change in entropy will include a contribution in the form of a change in entropy during the phase transformation
And finally, the last contribution to the total change in entropy will be made by a change in entropy with further heating of the already formed liquid
Obviously,
Calculation of entropy during chemical reactions


Examples of problem solving
Example 1. Calculate the change in entropy of 1 kg of ethylene glycol when it is heated from a temperature of 100 to 300 °C.
Using the reference book, we determine that the temperature of the ethylene glycol (liquid)–ethylene glycol (gas) phase transition is 479.4 K. We convert the temperature of the problem condition into a thermodynamic scale - the Kelvin scale and conclude that the temperature interval from the problem condition must be divided into two intervals. The first, from 373 K to 479.4 K, characterizes the state of ethylene glycol in the form of a liquid, and the second interval, from 479.4 K to 573 K, will correspond to the gaseous state of ethylene glycol.
Taking into account the above and the values given in the reference book, we obtain
The value of the entropy of phase transformation, i.e. the value of the entropy of evaporation

Example 2. What is the molar entropy of ethylene glycol at 350 K?
Let's use the basic calculation formula

Moreover, as the lower level of reference we will take the absolute value of entropy at 298 K and a pressure of 1 atm (298) stks (this is a reference value equal to 167.32 J/(mol. K)). It is known that at 298 K and 350 K ethylene glycol is in a liquid state, its molar isobaric heat capacity is constant and equal, and as the lower level of reference we take the absolute value of entropy at 298 K and a pressure of 1 atm (298) stks (this is a reference value equal to 167 .32 J/(mol⋅K)). It is known that at 298 K and 350 K ethylene glycol is in a liquid state, its molar isobaric heat capacity is constant and equal to https://pandia.ru/text/80/204/images/image047_2.jpg" width="474" height=" 71">
Example 3. There is an ideal gas - benzene, its mass is 0.4 kg. It is in state 1 at a temperature of 600 K and a pressure of 2.5 atm. It was transferred to state 2, at which the temperature is 298 K and the pressure is 1 atm. What are the changes in the molar and total entropy of the system during this transition?
From the reference book we determine the coefficients of the temperature dependence of the molar isobaric heat capacity
Find the change in molar entropy of an ideal gas at this temperature
https://pandia.ru/text/80/204/images/image051_4.jpg" width="266" height="65">
Since the expansion is reversible, the total change in the entropy of the Universe is 0, so the change in the entropy of the environment is equal to the change in the entropy of the gas with the opposite sign:

b) Entropy. state function, therefore the change in the entropy of the system does not depend on how the process occurred. reversible or irreversible. The change in gas entropy during irreversible expansion against external pressure will be the same as during reversible expansion. But the entropy of the environment will be different. It can be found by calculating the heat transferred to the system using the first law:

In this derivation we used the fact that ΔU = 0 (temperature is constant). Work done by the system against constant external pressure 38
is equal to A = − p(V2−V1), and the heat accepted by the environment is equal to the work done by the system, with the opposite sign.
The total change in entropy of the gas and the environment is greater than 0:

as expected for an irreversible process.
Example 5. Calculate the change in entropy of 1000 g of water as a result of its freezing at −5 °C. The enthalpy of melting of ice at 0°C is 6008 J/mol. The heat capacities of ice and water are considered constant in this temperature range and equal to 34.7 and 75.3 J/(mol⋅K), respectively. Explain why entropy decreases during freezing, although the process is spontaneous.
O The irreversible process of freezing water at a temperature of −5 C can be represented as a sequence of reversible processes:
1) heating water from −5°C to freezing temperature (0°C);
2) freezing of water at 0 °C;
3) cooling ice from 0 to −5 °C:
The change in the entropy of the system in the first and third processes (with a change in temperature) is calculated using formula (18):

https://pandia.ru/text/80/204/images/image058_2.jpg" width="364" height="59">
Since entropy is a function of state, the total change in entropy is equal to the sum over these three processes:
Entropy decreases during freezing, although the process is spontaneous. This is due to the fact that heat is released into the environment and the entropy of the environment increases, and the increase is greater than 1181 J/K; as a result, the entropy of the Universe increases when water freezes, as expected in an irreversible process.
Example 6. One vessel with a capacity of 0.1 m3 contains oxygen, and another vessel with a capacity of 0.4 m3. nitrogen In both vessels the temperature is 290 K and the pressure is 1.013.105 Pa. Find the change in entropy during mutual diffusion of gases from one vessel to another at constant pressure and temperature. Consider both gases to be ideal.
The change in entropy is determined by formula (74). The number of moles of each gas is found using the Mendeleev-Clapeyron equation:
 https://pandia.ru/text/80/204/images/image062_1.jpg" width="432" height="54 src=">
Example 7. The enthalpy of vaporization of chloroform is 29.4 kJ/mol at its normal boiling point (334.88 K). Calculate the molar entropy of evaporation at this temperature.
We find the change in entropy using formula (25):
4. The system transitions from state 1 to state 2 in two ways: reversible (absorbs heat Qrev) and irreversible (absorbs heat Qrev). What is the relationship between Qrev and Qrev? What is the relationship between ΔSrev and ΔSrev?
5. Determine the number of microstates and the entropy of a sodium crystal weighing 2.3 g at 0 K if it contains three potassium atoms replacing sodium atoms in its structure.
6. For one mole of substance AB, calculate the number of microstates and entropy for an ideal crystal at 0 K, as well as for a crystal that has a single defect: one D− ion replaced one B− ion at a crystal lattice site.
7. In which of the following cases: a) in a process in which ΔCp = 0; b) during a reversible isothermal phase transition; c) in an adiabatic process; d) in the process at constant pressure?
8. Write down an expression to calculate the change in entropy during a phase transition. Formulate Truton's rule and indicate the scope of its application.
9. Why is the term “entropy of education” not used in practice? If we introduce such a term by analogy with the enthalpy of formation, then what sign will the entropy of formation have: a) sugar, b) molecular oxygen?
10. Estimate the change in entropy in the reaction CO2(g) + 4H2(g) → CH4(g) + 2H2O(l) at 298 K and partial pressures of gaseous substances equal to 2 atm, if ΔrS o 298 = − 98 cal mol− 1·K−1. Please indicate the assumptions used.
11. Find the change in entropy during the isothermal expansion of one mole of van der Waals gas from volume V to volume 2V.
12. In the temperature range from 298 to 1000 K, the heat capacity of substance A is described by the following equation: Cp = a + bT + cT 2, where a, b and c are constants for substance A. Calculate the change in enthalpy and entropy of the substance when heated from 300 to 500 K.
13. Calculate the change in entropy when heating 1.5 mol Ni from 25°C to 1450°C. The molar heat capacities of Ni are given by the equations: Cp(α-Ni) = 16.99 + 29.46 ⋅10−3T , J mol−1 K−1, Cp(β-Ni) = 25.19 + 7.53 ⋅ 10−3T , J mol− 1·K−1. The temperature of the polymorphic transition of α-Ni to β-Ni is 360°C, the heat of the α→β transition ΔHo = 0.38 kJ mol−1.
14. In the temperature range from 0 to 12 K, the heat capacity of silver is well described by Debye’s “law of cubes” CV = αT 3, and the experimental value of the heat capacity of silver at 12 K Cp,12 is known. How to calculate the change in enthalpy and entropy of silver when heated from 0 to 12 K? Is it possible to calculate the absolute values of H12 and S12 for silver?
16. Write down an equation to calculate the entropy of mixing of two ideal gases at constant temperature. Why is this value always positive?
17. Calculate the change in entropy in an isolated system when adding 100 g of ice with a temperature of 0°C to 1000 g of water with a temperature of 20°C. The heat capacity of liquid water is 4.184 J g−1 K−1, the heat of fusion of ice is 6.0 kJ mol−1.
18. Calculate the temperature of the mixture and the change in entropy during the mixing of 3 kg of water at 353 K with 6 kg of water at 290 K. Assume that the heat capacity of water Cp is equal to 75.3 J mol−1 K−1 and does not depend on temperature.
19. Ice weighing 1 g at 0°C is added to 10 g of water, the temperature of which is 100°C. What is the final temperature of the mixture and what is the change in entropy during this process? The enthalpy of melting of ice is 80 cal g−1, Cp of water is 1 cal g−1 K−1.
20. The enthalpy of melting of ice at 273 K is 1436 cal mol−1, the Cp of ice and liquid water are 8.9 and 18.0 cal mol−1 K−1, respectively. Calculate the change in entropy in the nonequilibrium process of solidification of water at 263 K.
Calculate the change in entropy during the melting of three moles of supercooled benzene at 270 K, if at 278.65 K its enthalpy of melting is equal to 2379.5 cal mol−1, the heat capacities of liquid and solid benzene are equal to 30.4 and 29.5 cal mol−1 K−1, respectively, and the pressure constant and equal to 1 atm.
Literature
1. Shapovalov synergetics: Macroscopic approach M.: Firm "Ispo-Service" 2000. Ch. 2-3
2. Bazarov M.: Higher. school 1991. Chapter 3
3. Zelentsov “OOOFizikon” 2002 Media disc


The second law of thermodynamics in the form written for equilibrium processes allows one to calculate not the absolute value of entropy, but only the difference in entropies in two states of the system.
 . (2.4)
Consider for 1 mole of substance :
a) Isothermal processes (T = const).
At a constant temperature, processes of phase transformations of substances occur: melting, evaporation, and others. When these processes occur in equilibrium, the pressure usually remains constant, therefore  And
And
 , (2.5)
Where  – enthalpy of phase transition.
b) Isobaric processes (R = const).
If heating occurs at constant pressure, then
 , (2.6)
Where n– number of moles of substance. Then
 . (2.7)
Example 2.1. Determine the change in entropy when heating 1 mole of Al from 25 to 600 0 C, if for it in this range the heat capacity depends on temperature as follows:
 , (J/mol K).
Solution. According to equation (2.7) we have:
 ,
,
(J/mol K).
c) Isochoric processes (V = const).
If heating occurs at a constant volume, then
 . (2.8)
 . (2.9)
For 1 mole of an ideal gas it is true :
a) When changing volume and temperature
 , (2.10)
taking into account that  .
.
b) When pressure and temperature change
 . (2.11)
For any substance at any temperature, the absolute value of entropy can be determined if we use postulate Plank : The entropy of a properly formed crystal of any individual substance at absolute zero is zero.
If a substance at a temperature T is in a gaseous state, then its absolute entropy can be calculated using the formula:
The change in entropy during a chemical reaction is calculated using the formula:
Where  - standard entropies of substances at T= 298.15 K.
Each substance is characterized by a standard entropy  – entropy of 1 mole of a substance at 298.15 K and a pressure of 1 atm. Entropy values have the dimension J/(mol K) or cal/(mol K). The standard entropies of simple substances are not zero.
For irreversible processes  and equation (2.4) is not applicable. Entropy is a function of state and its change does not depend on the path of the process, but is determined by the final and initial state of the system. The change in entropy in any nonequilibrium process can be calculated by replacing it with a certain set of equilibrium processes passing between the same initial and final states, for each of which the value can be calculated
  . Then:
 . (2.14)
In isolated systems, entropy only increases and reaches a maximum at equilibrium. Therefore, it can be used as a criterion for the occurrence of spontaneous processes in such systems. However, in practice, most processes occur in non-isolated systems, as a result of which they must choose their own criteria for directing spontaneous processes and achieving equilibrium in these systems. Such criteria are other thermodynamic functions other than entropy and internal energy. They are selected in such a way that with their help it is possible to determine in explicit form all the thermodynamic parameters of the system under study. All of them are functions of the state and change unambiguously when the system moves from one position to another. When the system reaches an equilibrium state, each of the functions passes through a minimum value. Such properties determine the widespread use of these functions in the analytical method for solving various problems of thermodynamic research.
It should be noted that such functions are often called characteristic. Characteristic function is called a function of the state of a system, through which and its derivatives all the thermodynamic properties of the system can be expressed in explicit form.
According to the first law of thermodynamics :
A = Q – dU. (2.15)
Substituting here the well-known relation Q ≤ TdS, we get
A ≤ TdS – dU, (2.16)
where the equal sign refers to reversible equilibrium processes, and the inequality sign refers to irreversible ones. Let us integrate (2.16) for T = const:
A T ≤ T(S 2 – S 1) – (U 2 – U 1) = (U 1 – T.S. 1) – (U 2 – T.S. 2). (2.17)
Function ( U – T.S.) plays an important role in the study of equilibrium in isothermal processes. They call her isochoric-isothermal potential or Helmholtz energy and is designated by the symbol F. Moreover, for any isothermal process:
dF = dU – TdS, (2.18)
∆F = ∆U – T∆S, (2.19)
and the maximum work in an isothermal process is
(A T)max = –∆F. (2.20)
Function F determines the direction and limit of spontaneous processes occurring at constant temperature and volume.
Close to the isochoric-isothermal potential is a function that determines the direction and limit of the spontaneous occurrence of processes for systems at constant temperature and pressure. This function is called isobaric-isothermic potential or Gibbs energy , denoted by the symbol G and is defined as
G=H – T.S.. (2.21)
G=U – TS + pV = F+pV. (2.22)
Let R= const, then
A T ≤ –∆F = F 1 – F 2 , (2.23)
A T + p(V 2 – V 1) ≤ F 1 – F 2 , (2.24)
A T ≤ (F 1 +pV 1) – (F 2 + pV 2) = G 1 – G 2 , (2.25)
Where A T – useful work (any work other than expansion work). Then
A T ≤ –∆G. (2.26)
Moreover, for isothermal processes
 , (2.27)
and maximum work in an isothermal process
 , (2.29)
those. the maximum useful work is equal to the maximum work of the isothermal process minus the work against external pressure forces. Functions G And F are called thermodynamic potentials , because under certain conditions they tend to a minimum during spontaneous processes.
Let  , Then
 . (2.30)
1). System at T, V = const
 , i.e. Δ F≤ 0. Equilibrium condition in an isochoric-isothermal system: dF = 0,
Δ F = 0,
F
= F min.
, i.e. Δ F≤ 0. Equilibrium condition in an isochoric-isothermal system: dF = 0,
Δ F = 0,
F
= F min.
2). System at R, T = const. Then  Equilibrium condition in an isobaric-isothermal system: dG = 0,
Δ G = 0,
G
= G min.
Equilibrium condition in an isobaric-isothermal system: dG = 0,
Δ G = 0,
G
= G min.
Conclusion: in systems at constant temperature and volume, only those processes that are accompanied by a decrease in the Helmholtz energy can occur spontaneously F, and the limit of their occurrence, i.e. equilibrium condition is the achievement of a certain minimum value of the function for given conditions F; in systems at constant temperature and pressure, only those processes that are accompanied by a decrease in the Gibbs energy can occur spontaneously G, and the limit of their occurrence, i.e. the condition of equilibrium is the achievement of a certain minimum value of the function for given conditions G.
We obtain relations that describe the dependence  And
And  on temperature. In general (and for chemical reactions):
The state function has the properties of a complete differential, i.e. If  , That
 . (2.33)
On the other side:
F=U – T.S., (2.34)
dF = dU – TdS – SDT. (2.35)
Considering that
dU =, (2.36)
we get
 . (2.37)
When comparing equations (2.37) and (2.33) it is clear that

 , (2.38)
 . (2.39)
Likewise for  , we get:
 , (2.40)

 , (2.41)
 . (2.42)
Substituting relations (2.39) and (2.42) into equations (2.31) and (2.32), respectively, we obtain:
 , (2.43)
 . (2.44)
The last two equalities are the required dependencies  And
And  on temperature and they are called Gibbs-Helmholtz equations
.
on temperature and they are called Gibbs-Helmholtz equations
.
The first law of thermodynamics states that although energy can be transferred between a system and its environment, energy is never created or destroyed. Thus, this law imposes the requirement of conservation of energy on chemical and physical transformations. At one time it was believed that all chemical reactions are exothermic, in other words, a chemical reaction can only occur if the system loses energy. However, many chemical and physical transformations are now known to be endothermic. Consequently, it is still impossible to predict from a change in energy or enthalpy alone whether a reaction will occur spontaneously or not. To predict whether a reaction can occur spontaneously, it is necessary to introduce another thermodynamic state function called entropy. Entropy is usually denoted by the letter S.
Entropy can be described as a measure of randomness, disorder, or disorder in a system. For example, we have already indicated that gas particles are much
Rice. 5.16. Spontaneous mixing of two gases leads to an increase in entropy, but is not accompanied by a total change in energy in the system.
more unordered than particles of solid matter; therefore, the entropy of gases is generally much greater than that of solids.
But how, knowing entropy, can one predict whether a certain transformation is spontaneously feasible? To answer this question, consider a system consisting of two vessels connected to each other by a tube with a tap (Fig. 5.16). Let us assume that these vessels contain different gases. If you open the tap, the gases will begin to mix spontaneously as a result of diffusion (see section 3.1). After mixing, the gases will be in a state with a greater degree of disorder than before mixing. Therefore, after mixing, they have greater entropy. There is no change in energy in this process. The total enthalpy of gases before and after mixing is exactly the same. However, mixing results in a more chaotic distribution of energy.
In many chemical reactions, energy redistribution also occurs. For example, combustion reactions are exothermic processes. As a result of combustion, energy is released and redistributed into the environment. Thus, entropy can be considered as a measure of energy distribution. The occurrence of chemical reactions is always accompanied by a redistribution of energy either from the chemical system to its environment, or, conversely, from the environment to the chemical system. Thus, in a chemical reaction there is always a change in entropy. It is this change in entropy, along with the change in enthalpy in the reaction, that must be taken into account if it is necessary to predict whether the spontaneous occurrence of the chemical reaction in question is possible. However, before we discuss the relationship between changes in entropy and enthalpy and the possibility of spontaneous reaction, it is necessary to become familiar with the second law of thermodynamics.
This law states that all spontaneously occurring processes are necessarily accompanied by an increase in the total entropy of the system and its environment. The second law of thermodynamics is perhaps one of the most general provisions of all science as a whole. There are many different formulations of this law. But the main idea of all these formulations is that in any isolated system, over time, there is a constant increase in the degree of disorder, i.e. entropy.
Some formulations of the second law of thermodynamics
1. Each system, left to itself, changes on average in the direction of the state with maximum probability (G. Lewis).
2. The state with maximum entropy is the most stable state for an isolated system (E. Fermi).
3. During the course of any real process, it is impossible to provide a means of returning each of the systems participating in it to its original state (G. Lewis).
4. Every physical or chemical process in nature occurs in such a way that the sum of the entropies of all bodies that take part in this process increases (M. Planck).
5. Spontaneous transfer of heat from a colder to a hotter body is impossible.
6. Obtaining information is a decrease in entropy (G. Lewis).
7. Entropy is the arrow of time (A. Eddington).
This formulation should be understood in the sense that the change in entropy can be used to judge the sequence of various spontaneous events. - Approx. translation
From the second law of thermodynamics it follows that for any spontaneous processes
where the total (total) change in entropy as a result of a chemical or physical transformation is determined by the expression
Entropy changes in chemical reactions
The entropy of one mole of a substance in its standard state at the appropriate temperature is called standard molar entropy. Standard molar entropy is indicated by the symbol and has the dimension In table. 5.12 shows the standard molar entropies of a number of elements and compounds at temperature. Note that the standard molar entropy of gases, as a rule, has much higher values compared to the entropy of solids. The entropy of any fixed amount of matter increases in the following sequence:
Standard molar entropies are sometimes called absolute entropies. They are not changes in entropy that accompany the formation of a compound from the free elements included in it. It should also be noted that the standard molar entropies of free elements (in the form of simple substances) are not equal to zero.
The third law of thermodynamics states that the entropy of an ideal ionic crystal at absolute zero (0 K) is zero.
Table 5.12. Standard molar entropies

The change in standard molar entropy in a chemical reaction is given by the equation
Let us calculate the standard molar entropy change for the complete combustion of one mole of hydrogen gas at 25°C, using the data given in table. 5.1.
The equation of the reaction under consideration has the form
Applying equation (16), we find
Substituting into this equation the entropy values at a temperature of 298 K from the table. 5.12 gives
It should be noted that the change in entropy in the example considered turns out to be negative. This could be expected if we consider that, according to the equation of the reaction in question, the total amount of gaseous reactants is 1.5 mol, and the total amount of gaseous products is only 1 mol. Thus, as a result of the reaction, the total amount of gases decreases. At the same time, we know that combustion reactions are exothermic reactions. Consequently, the result of their occurrence is the dissipation of energy, and this leads us to expect an increase in entropy, and not its decrease. Further, it should be taken into account that the combustion of hydrogen gas at 25°C, caused by the initial initiation, then proceeds spontaneously and with great intensity. But shouldn’t the change in entropy in this reaction be positive in this case, as required by the second law of thermodynamics? It turns out - no, or at least not necessarily. The second law of thermodynamics requires that, as a result of a spontaneous process, the total entropy of the system and its environment increases. The change in entropy calculated above characterizes only the chemical system under consideration, consisting of reagents and products that take part in the combustion of hydrogen gas at 25°C. How can we calculate the change in entropy for the environment of this system?
Thermodynamic considerations make it possible to show that the change in entropy is equal to the ratio of the energy transferred in the form of heat to the absolute temperature T at which this energy transfer occurs, i.e.
This change in entropy can be attributed to either the system or its environment. However, there is one condition. Thermal energy q must be transferred in a reversible way. In thermodynamics, a reversible process is a process that is carried out infinitely slowly and carefully, so that it is practically in a state of equilibrium all the time. In an exothermic process, the energy lost by the system is equal to the energy gained by the system's surroundings. Conversely, in an endothermic process, the energy absorbed by the system is equal to the energy lost by the system's surroundings. Therefore we can write
We previously stated that at constant pressure, the energy transferred in the form of heat during a chemical reaction is equal to the enthalpy change. Hence,
Let us now use equation (18) and rewrite equation (17) in this form:
Mokruzhnye
It was shown above that the total change in entropy during a spontaneous process is equal to the sum of the change in the entropy of the system and the change in the entropy of the system’s environment (see equation (15)). The change in entropy in the system where the chemical reaction occurs is determined by equation (16), and the change in entropy in the environment of the system is determined by equation (20). We can now calculate the total change in entropy that accompanies a chemical transformation and check whether the result satisfies the second law of thermodynamics.
Let us calculate the total change in entropy that accompanies the combustion of one mole of hydrogen gas at 25°C. Does the calculation result satisfy the second law of thermodynamics?
The total change in entropy that accompanies any process is determined by equation (15). Substituting expression (20) into it, we obtain
The resulting equation relates to the combustion of one mole of hydrogen gas under standard conditions according to the chemical equation given in the previous example.
According to the conditions of the problem, .
The value was calculated in the previous example and found to be equal to
Standard enthalpy of hydrogen combustion, according to table. 5.2, equal
Hence,
Note that although the change in entropy in a reaction system is negative, the overall change in entropy that accompanies the reaction is positive. Therefore, the result we obtained satisfies the second law of thermodynamics.
LECTURE 11
Phase diagrams
Phase is a state of matter characterized by the fact that it occupies a certain region of space, and within this region the parameters and properties of the substance either remain constant or change continuously. This spatial region is separated from other parts of space by a boundary. The mass of a substance contained in one phase may change over time. In this case they talk about phase transition. The phase transition occurs through the phase interface. The following most common phase transitions are distinguished:
boiling (transition of a substance from liquid to vapor);
condensation (transition of a substance from vapor to liquid);
crystallization, hardening (transition of a substance from a liquid to a solid state);
melting (transition of a substance from solid to liquid).
It is convenient to depict phases on phase diagrams. A phase diagram is a plane with a Cartesian coordinate system shown on it, along the axes of which the values of a pair of basic thermodynamic parameters are plotted. This plane is divided into a number of regions, each of which represents a certain phase. The phase diagram also shows the main isolines (lines of constancy of the main thermodynamic parameters: isochores, isobars, isotherms, isentropes, isoetalpes and lines of constant dryness.
The most common phase diagrams are T-S, P-V, H-S, H-lgP. Let's consider the T-S phase diagram. In Fig. Figure 31 shows the main phases and phase boundaries:
 |
F - liquid
F + T - liquid + body
NC – supercritical region
G – gas regionVP – wet steam
bkc – saturation curve. Characterizes the saturated state of a substance.
bk – line of saturated liquid. Saturated liquid- this is a liquid state of a substance, characterized by the fact that the supply of an arbitrarily small amount of heat leads to intense formation of steam.
ks – dry line saturated steam. This is the gaseous state of a substance, characterized by the fact that any slight cooling leads to the beginning of the condensation process.
abc - line of triple dots. Triple point- this is a state of matter characterized by the equilibrium coexistence of three phases at once: solid, liquid and gas. Phase equilibrium characterized by the fact that there is no phase transition between phases. Under constant external conditions, phase equilibrium can coexist as long as desired. In order for two phases to be in a state of equilibrium, three conditions must be met: 1) the phases must have the same pressure; 2) the phases must have the same temperature; 3) phases must have chemical potential.
be – line of the beginning of the solidification process or the end of the melting process.
ad - line of the end of the solidification process or the beginning of the melting process.
dek is the critical temperature isotherm.
P=P cr – critical isobar.
k – critical point. It is characterized by the fact that at a temperature above the critical temperature, it is impossible to obtain liquid using isothermal compression. Critical pressure and temperature are pressures and temperatures below the critical point.
Region G – gas region. This region is located at a pressure below critical and a temperature above critical. The gas region is characterized by the fact that the state of the gas in this region is described by the equation of state of an ideal gas.
PP area - superheated steam region. Located at a temperature below critical and to the right of the kc line. This region is characterized by the fact that the behavior of matter in it is described by the van der Waals equation or the modified ideal gas equation
| , | (130) |
where z is the compressibility coefficient (a correction factor that takes into account the deviation of the behavior of real substances from an ideal gas).
Area F+P - wet steam area. Limited by saturation curve and triple point line. This is a two-phase region characterized by the equilibrium state of saturated vapor and saturated liquid. This is the area where condensation and boiling processes occur.
Region J. - supercooled liquid region. It is limited from above by the critical isotherm, on the right - by the line of saturated liquid, on the left - by the line of the beginning of crystallization.
The T+L region is a two-phase region of equilibrium coexistence of the liquid phase and the solid. This is the area where solidification (crystallization) and melting processes occur.
The T+P region is a two-phase region of equilibrium coexistence of saturated vapor and a solid. From above, this area is limited by a line of triple points. Triple point is called a state of equilibrium of three states of aggregation at once. This is the area where the processes of sublimation and desublimation occur. Sublimation called the process of transition of the solid phase into the gaseous phase. Desublimation called the process of transition of saturated steam into the solid phase.
The NC region is the region of the supercritical state of the substance. Located at pressure and temperature above critical. It is characterized by the fact that a substance in this state has the properties of both a liquid and a gas.
In Fig. Figure 32 shows the main process lines.
Isobars corresponding to pressures Р 1 , Р 2 , Р 3 = Р кр and Р 4 are depicted by solid lines. In this case, the relations P 1 are satisfied between these pressures<Р 2 <Р 3 <Р 4 . Следует отметить, что процессы, что процессы, протекающие в двухфазных областях, изображаются горизонтальными линиями, т.е. эти изобарные процессы одновременно являются изотермическими. Изобара с давлением Р 4 лежит выше критической точки не проходит через область влажного пара, а сразу из области надкритического состояния попадает в область переохлаждённой жидкости. Изобара с давлением Р 1 лежит ниже линии тройных точек, также не проходит через область влажного пара, а из области перегретого пара попадает в область твёрдого состояния вещества посредством процесса десублимации. Изобара с давлением Р 3 касается критической точки. Изобара с давлением Р 2 , проходя через область влажного пара, реализует процесс кипения или конденсации.
Isochores in v 1 and v 2 (v 1 >v 2) depicted by dashed lines are located more steeply in the T-S diagram than isobars. It should be noted that in two-phase regions isochores do not coincide with isotherms, i.e. not horizontal.
The isenthalpes h 1 , h 2 and h 3 (h 1 >h 2 >h 3 ) are depicted by dotted lines. You can pay attention to the fact that as the temperature decreases, the angle of inclination of the isenthalpe to the S axis increases.
Wet steam
Wet vapor is a state of matter in which saturated vapor and saturated liquid are in equilibrium. Equilibrium is due to the equality of their temperatures and pressures. The wet steam region finds greatest application in thermal power and low-temperature devices, because in this area it is most easy to implement processes that are important in technical applications (isothermal).
The wet steam region depicted in the T-S diagram is shown in Fig. 33.
 |
Point “a” characterizes the state of wet steam, in which saturated liquid and saturated steam are in equilibrium in certain mass fractions.
Saturated vapor is in a state, and the state of a saturated liquid is characterized by a point. Let wet steam a in the state of point a occupy a certain volume, where m is the mass of wet steam; v a - specific volume of wet steam. The same volume can be considered as the sum of the volumes of saturated liquid and saturated vapor
| , | (131) |
where is the volume of saturated liquid;
Volume of saturated steam;
Mass of saturated liquid;
Saturated steam mass;
Specific volume of saturated liquid at point state;
Specific volume of saturated steam at point state.
In this case, the relationship is obvious
Dividing both sides of the equation by m in the last expression, we obtain an equation expressing the specific volume of wet steam through the specific volumes of saturated liquid and saturated steam
| . | (133) |
In this expression, the degree of dryness of wet steam, which shows the mass fraction of saturated steam in wet steam. If x=1, then the wet steam consists entirely of saturated steam. If x=0, then the wet steam consists entirely of saturated liquid. The degree of dryness can take any value from 0 to 1. The set of all points of the wet vapor area on the T-S diagram that have the same value for the degree of dryness are called lines of constant dryness (see Fig. 33).
Using exactly the same reasoning, using the property of additivity of enthalpy and entropy, one can obtain the expressions
| , | (134) |
| , | (135) |
where is the specific enthalpy of the saturated liquid in the point state;
Specific enthalpy of saturated steam at a point;
Specific entropy of a saturated liquid in a point state;
Specific entropy of saturated steam in the point state.
Let us express x from the last equation
| . | (136) |
From this formula it follows that to increase the degree of dryness, you need to increase entropy, i.e. add heat to wet steam. In this case, the proportion of saturated liquid will decrease, and the proportion of saturated vapor will increase. The parameters of the saturated liquid and saturated vapor will not change. This process is called boiling. If heat is removed from wet steam, then the entropy will decrease, which means the degree of dryness will decrease, i.e. the substance will pass from the saturated vapor state to the saturated liquid state. This process is called condensation.
In order to completely convert 1 kg of saturated liquid into the state of dry saturated vapor, it is necessary to supply a certain amount of heat, which is called the specific heat of vaporization r,.
In an isobaric process, such as boiling or condensation, the heat added or removed is equal to the change in enthalpy. Therefore the relation is valid
LECTURE 12
Thermodynamic cycle
Thermodynamic cycle is called a closed thermodynamic process, i.e. a process as a result of which the system returns to its original state. Another definition can be given to the thermodynamic cycle as a sequence of thermodynamic processes, the implementation of which leads the system to its initial state. Let us write the first law of thermodynamics for a closed system in the form
Since the system returns to its original state, then . The result is a generalized thermodynamic cycle equation
where Q 1 is the total heat supplied to the system in the cycle;
Q 2 is the total heat removed from the system in the cycle.
Substituting (140) into (139), we get
| . | (141) |
In this expression, the removed heat is taken to be positive, because the sign of the heat removed is taken into account in the formula with a minus in front of Q 2 .
Equation (141) allows us to classify thermodynamic cycles into two types:
1. if , then the cycle is called direct;
2. if , then the cycle is called inverse.
Direct cycle
Direct cycle also called thermal power. This is a cycle, as a result of which the system produces, i.e. performs work due to the heat supplied to the system.
A schematic diagram of a device that implements a direct, or thermal power, cycle is shown in Fig. 34.
In this picture:
TDS(M) is a thermodynamic system (machine) that performs a cycle;
GI – hot spring with temperature T GI. It is understood as a set of environmental bodies that transfer heat Q 1 to the thermodynamic system.
CI is a cold source, or refrigerator, with a temperature of T CI. This is a set of environmental bodies to which the system, completing a cycle, gives off heat Q 2. In order for the diagram presented in Fig. 34 could be implemented, the cold source should have a temperature T CI lower than the temperature of the hot source T CI (T CI<Т ГИ). Кроме того, температура холодного источника должна быть меньше минимальной температуры системы в цикле, а температура горячего источника должна быть больше максимальной температуры системы.
 |  |
Rice. 35. Fig. 36.
In Fig. Figure 35 shows the thermal power cycle in the T-S diagram. Process 1a2 is accompanied by the supply of heat Q 1, because entropy increases. In this case, the heat supplied is equal to the area under line 1a2. In process 2b1, heat Q 2 is removed, because entropy decreases, and this heat is equal to the area under the 2b1 line. From the figure it can be seen that the area of the figure m1a2n is greater than the area of m1b2n, therefore Q 1 >Q 2, and this cycle is straight. As a result, the difference between the supplied and removed heat is equal to the work of the cycle, and is equal to the area of the cycle.
In Fig. Figure 36 shows the thermal power cycle in a P-V diagram. Process 1a2 is accompanied by the performance of work L 1 a 2, because the volume in this process increases. In this case, the work done is equal to the area under line 1a2. In process 2b1, work L 2 b 1 is wasted, because the volume decreases, and this work is equal to the area under the line 2b1. From the figure it is clear that the area of the figure m1a2n is greater than the area of m1b2n, therefore L 1 a 2 >L 2 b 1, and this cycle is straight. As a result, the difference between the work done and the work expended is equal to the work of the cycle and equal to the area limited by the cycle.
Any cycle, both direct and reverse, is characterized by an efficiency coefficient that evaluates the efficiency of the energy conversion process
Since, due to the definition of a direct cycle, the efficiency is always less than one. The process of converting thermal energy into useful work in a cycle is more effective the closer the cycle efficiency value is to unity.
Reverse cycles
A reverse cycle is a cycle in which the heat supplied is less than the heat removed. As a result, the work of the reverse cycle is negative, i.e. it requires work to implement it.
A schematic diagram of a device that implements the reverse cycle is shown in Fig. 37.
 |  |
Rice. 38. Fig. 39.
In Fig. Figure 38 shows the reverse cycle in the T-S diagram. Process 1a2 is accompanied by the supply of heat Q 1, because entropy increases. In this case, the heat supplied is equal to the area under line 1a2. In process 2b1, heat Q 2 is removed, because entropy decreases, and this heat is equal to the area under the 2b1 line. It can be seen from the figure that the area of the figure m1a2n is less than the area m1b2n, therefore Q 1 In Fig. Figure 39 shows the reverse cycle in a P-V diagram. Process 1a2 is accompanied by the performance of work L 1 a 2, because the volume in this process increases. In this case, the work done is equal to the area under line 1a2. In process 2b1, work L 2 b 1 is wasted, because the volume decreases, and this work is equal to the area under the line 2b1. It can be seen from the figure that the area of the figure m1a2n is less than the area m1b2n, therefore L 1 a 2 Reverse thermodynamic cycles are divided into three types: 1. refrigeration cycles; 2. heat pump cycles; 3. combined cycles. The refrigeration cycle is shown in Fig. 40 under the Roman numeral I. This is a reverse cycle in which work is expended to remove heat Q 1 from a cooled object located at a temperature T OO below the ambient temperature T OC. Refrigeration cycles are implemented in low-temperature units, in particular in household refrigerators. In this case, the heat Q 1 supplied to the working substance (freon) is the heat removed from the products in the freezer. Heat pump cycle II is a reverse cycle in which work is expended to supply heat Q 2 to the heated object at a temperature THO higher than the ambient temperature TOC. This cycle is implemented by household air conditioners operating in room heating mode. The heated object in this case is room air. The temperature of the heated object is room temperature. The environment is low-temperature outside air. The heat Q 2 used to heat the room in this case and determined by expression (144) is greater than the heat that would be supplied when heating the room with an electric heater, in which electrical energy L is converted into thermal energy. Combined cycle III is a reverse cycle in which work is expended to remove heat Q 1 from the cooled object, located at the temperature TOO below the ambient temperature, and simultaneously supply heat Q 2 to the heated object, located at the temperature TOO above the ambient temperature. The device that implements the combined cycle is a household refrigerator located in a residential area. In turn, from the outside of this room there is air with a low temperature. In this case, the heating object to which heat Q 2 is supplied (removed from the cycle) is the air in the room at room temperature. The object of cooling is the products in the freezer, from which heat Q 1 is removed and which is supplied to the freon circulating in the refrigerator. The efficiency factor of a refrigeration cycle is called the coefficient of performance ε. The useful energy in this case is the heat Q 1 removed from the cooled object and supplied to the working substance completing the cycle. The energy expended is the work supplied L. Therefore From this expression it is clear that the heating coefficient is always greater than unity, and the heat pump cycle is more efficient, the greater the value μ takes over unity. The combined cycle efficiency factor does not have a special name and is denoted by k. The useful energy in this case is the heat Q 1 removed from the cooled object, and at the same time the heat Q 2 supplied to the heated object. The energy expended is the work supplied L. Therefore From this expression it is clear that the efficiency coefficient of the combined cycle is certainly greater than unity, LECTURE 13 Reversible Carnot cycle All cycles, both direct and reverse, are divided into 2 types: reversible and irreversible. Reversible cycle called a cycle consisting only of reversible processes. Irreversible cycle is a cycle in which at least one irreversible process is present. In order for the process to be reversible, it must be in equilibrium, i.e. must flow at an infinitely slow speed. This is only possible if the potential difference interacting with the system and the environment is infinitesimal. For a thermodynamic system, this means that with reversible heat exchange with the environment, the temperature difference between the system and the environment should be an infinitesimal value, i.e. There must be no thermal resistance between the system and the environment. Reversible expansion and contraction is possible in the case of an infinitesimal pressure difference between the system and the environment. This is only possible when there is no friction in the system. It follows that in a thermomechanical system there are two sources of irreversibility: 1. the presence of thermal resistance between different parts of the system, which leads to a finite temperature difference during heat exchange; 2. the presence of friction in the system (or between the system and the environment), which leads to a finite pressure difference. Of all thermodynamic cycles, the reversible Carnot cycle (direct) is distinguished on the basis that for a given temperature difference between hot and cold sources, the reversible Carnot cycle has the highest possible efficiency. The reversible Carnot cycle shown in Fig. 41 and fig. 42, consists of two adiabats and two isotherms. Rice. 41. Fig. 42 1-2 – process of adiabatic expansion. In this process, work L 12 is performed. 2-3 – process of isothermal compression. In this process, work L 23 is expended and heat Q 23 is removed. 3-4 – process of adiabatic compression. This process consumes work L 34. 4-1 – process of isothermal expansion. In this process, work L 41 is performed and heat Q 41 is supplied. The main processes of the cycle are processes 4-1 and 1-2. They carry out the work of the cycle. The remaining processes are auxiliary and are aimed at returning the system to its original state with the least amount of energy. Let us determine the efficiency of the reversible Carnot cycle η bcc: By definition of efficiency (143) Substituting these expressions into (148) and reducing by the entropy difference, we obtain Based on the same considerations, we obtain This formula shows that The efficiency of a reversible Carnot cycle does not depend on the properties of the working fluid performing the Carnot cycle and is determined only by the temperatures of the hot and cold sources
. This conclusion is a formulation Carnot's first theorem. The entropy difference in two states is calculated especially simply if the reversible transition from one state to another occurs at a constant temperature. This occurs, for example, during transitions from one state of aggregation to another, during phase transitions. Equilibrium phase transformations (evaporation, melting, sublimation, etc.) occur under conditions of constant temperature and pressure. These processes are possible only when the heat spent on the process is supplied (or removed). Then formula (5) takes the form Where Where Let us consider the principles of calculating changes in the entropy of a pure ideal gas. It is known that internal energy is related to isochoric heat capacity by the relation For a closed system without chemical transformation, the fundamental Gibbs equation will be written as Let us express explicitly the dependence Or taking into account (18): Depending on which variables we take as independent in this equation, we will have three different expressions for calculating the change in entropy of an ideal gas during the transition from one state to another. Let us assume for simplicity that the heat capacity does not depend on temperature in the temperature range under study (from Where 1. Independent Variables From equation (21) using equation (22) and the ideal gas equation of state we get the equation which after integration ranging from 2. Independent Variables Integration (26) taking into account equation (13) gives another form of the entropy expression 3. Independent Variables Hence, taking into account (13) after integration: temperature and pressure If Equation (30) can be written differently, using the defining expression for the mole fraction of the component Since the mole fractions are always less than unity, the change in entropy is always positive, that is, ideal gases always mix irreversibly. If, under the same conditions, two portions of the same ideal gas are mixed, then equation (32) is not applicable. There is no change in the system upon mixing, and the change in entropy should be zero. However, formula (32) does not contain any individual gas parameters, therefore, it would seem that it should also be applicable to mixing identical gases. This contradiction is called Gibbs paradox.
.
(147)

 - latent heat of phase transformation. Formula (16) is applicable to calculating entropy during reversible melting of bodies, evaporation, sublimation, etc. At constant pressure, the latent heat of transformation is equal to the enthalpy change. That is, for example, for a phase transformation - evaporation, formula (16) will take the form
 ,
(17)
,
(17) - enthalpy of evaporation, J;
  - boiling point, K.
4. Change in entropy of an ideal gas
4.1. Change in entropy of a pure ideal gas during its transition from one state to another
 (18)
(18) (19)
(19) :
: .
(20)
.
(20) (21)
(21) before
  ), i.e.
  . Let us also take into account that the molar heat capacity is related to the total heat capacity of the system by the relation
 ,
(22)
,
(22) - number of moles of substance in the system, mol;
  - molar isochoric heat capacity, J/(K mol).
 And
And  :
:
 (23)
(23) ,
(24)
,
(24) before
  and from
  before
  will take the form
 (25)
(25) And
And  . Let us express the volume in (21) in terms of pressure and temperature, then
 (26)
(26) (27)
(27) And
And  .
Similarly, using the equation of state, we express temperature in terms of pressure and volume.
.
Similarly, using the equation of state, we express temperature in terms of pressure and volume. (28)
(28) (29)
(29)4.2. Mixing of ideal gases at constant
 moles of one ideal gas occupying a volume
  , mixed with
  moles of another ideal gas occupying the volume
  , then the total volume of the system will be
  , and the gases expand independently of each other and occupy the entire volume, so the total change in entropy is equal to the sum of the changes in the entropy of each gas:
 (30)
(30) (31)
(31)

In 2018, the Nativity Fast will begin on November 28. During this period, Orthodox believers prepare to celebrate Christmas...

Starting a family is the dream of most women. They want to have a loving husband and a bunch of kids. But it's not always a relationship...

This article contains: the most powerful prayer for divorce - information taken from all corners of the world, the electronic network and...

Information site about icons, prayers, Orthodox traditions. Prayer for scandals and quarrels in the family, with husband, with children...

What would New Year be without champagne, tangerines, Olivier, aspic and everyone’s favorite “Herring under a fur coat”. With the last one...

Let's prepare the necessary ingredients for the cookies. The first thing to do is put the water to boil. We need...

Is it possible to register an employee for the position of financial director - chief accountant? The chief accountant claims...

The head of a small business can easily manage the budget independently. CHECKED! If you manage...

The creation of new projects involves a preliminary economic justification for their feasibility, subsequent...
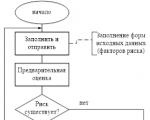
Reporting is generated by the RM, is agreed upon (approved) by the Risk Committee under the Management Board and transmitted to...

At the edge of a large, very large meadow, on a long emerald blade of grass lived a tiny Ladybug. God's little...

Nowadays, it is quite common for people to turn to the stars. With the help of a horoscope a person can find out...

Business or friendly. If you were pursuing a stranger, it means your level of trust in the female sex...

according to Freud's dream book If you dreamed about how you were fishing, it means that in real life you can hardly switch off...

Starting a family is the dream of most women. They want to have a loving husband and a bunch of kids. But it's not always...

This article contains: the most powerful prayer for divorce - information taken from all over the world, electronic...